Investment Review
The Notre Dame Endowment Pool performed well during a fiscal year characterized by market uncertainty, volatility, and a wide divergence of returns among asset classes, highlighting the benefits of diversification and manager selection. The 3.1 percent net return added significant value to the Endowment Pool relative to benchmark returns, with particularly strong performance coming from domestic private equity and fixed income. In a very difficult year for international equities, the Endowment’s emerging markets managers declined by only one percent while the benchmark index was down more than 16 percent.
Endowment Pool Investment Performance
(Annualized Returns Net of Fees)
Periods Ended June 30, 2012
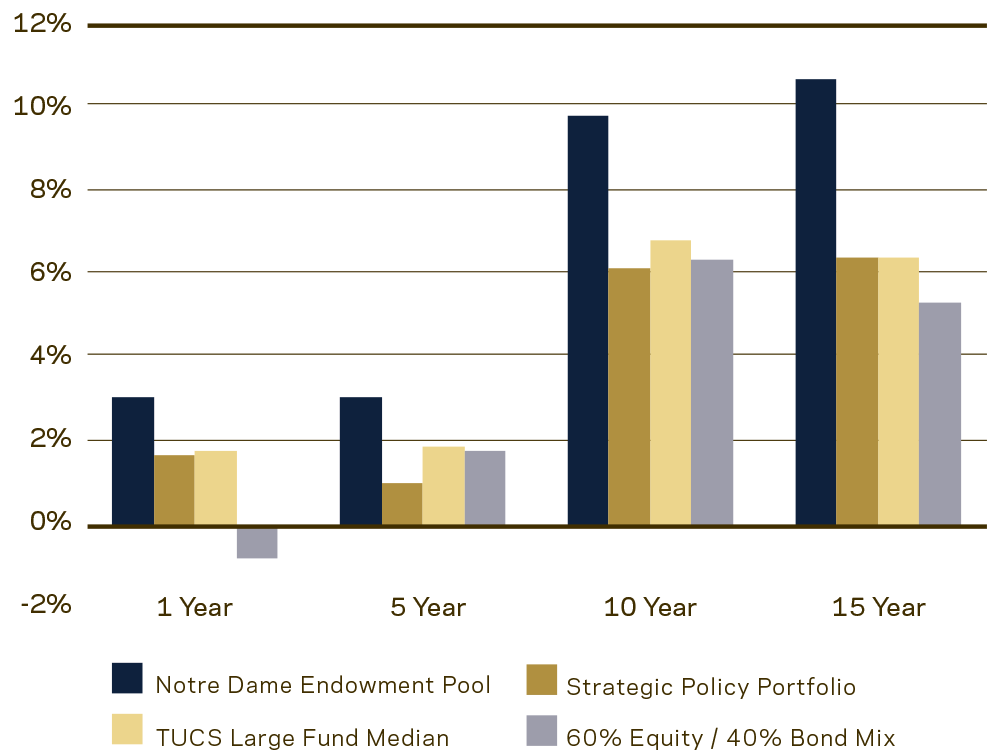
The Strategic Policy Portfolio is Notre Dame’s internal benchmark consisting of indices representative of the target investment portfolio. The Trust Universe Comparison Service (TUCS) Large Fund Median is a compilation of returns of endowment, pension and foundation investors greater than $1 billion and thus provides a basis for comparison to the performance of large institutional investors generally. The 60/40 mix is an index blend of stocks/bonds as represented by the MSCI All Country World Investable Index and the Barclays Capital U.S. Aggregate Bond Index.
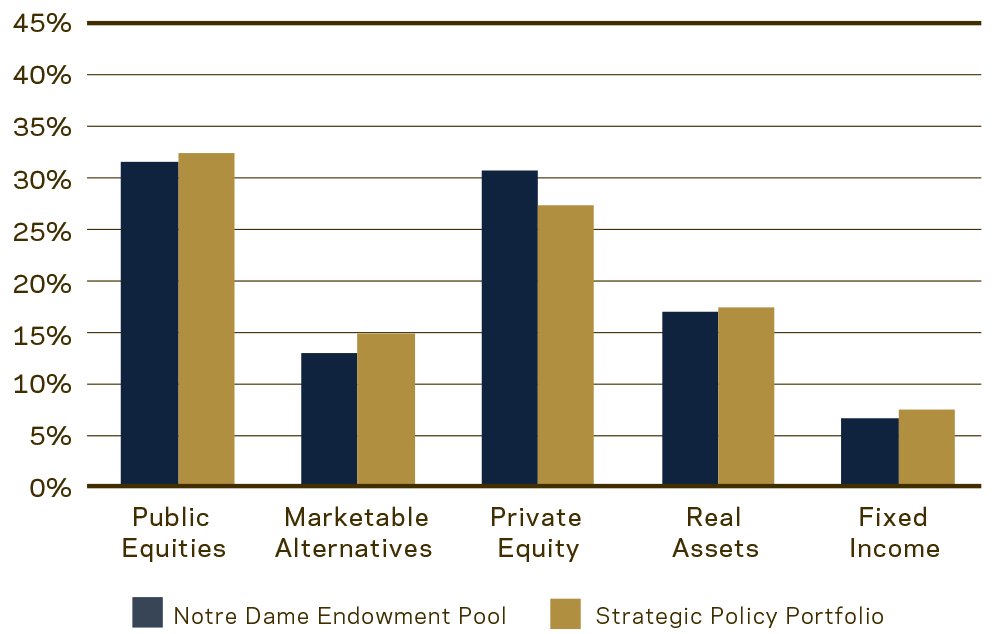
Asset allocation compared to the Strategic Policy Portfolio at the end of the fiscal year, and growth of the Endowment Pool over the last 15 fiscal years, are reflected in the following charts:
Endowment Pool Asset Allocation
As of June 30, 2012
Endowment Pool Market Value
As of June 30
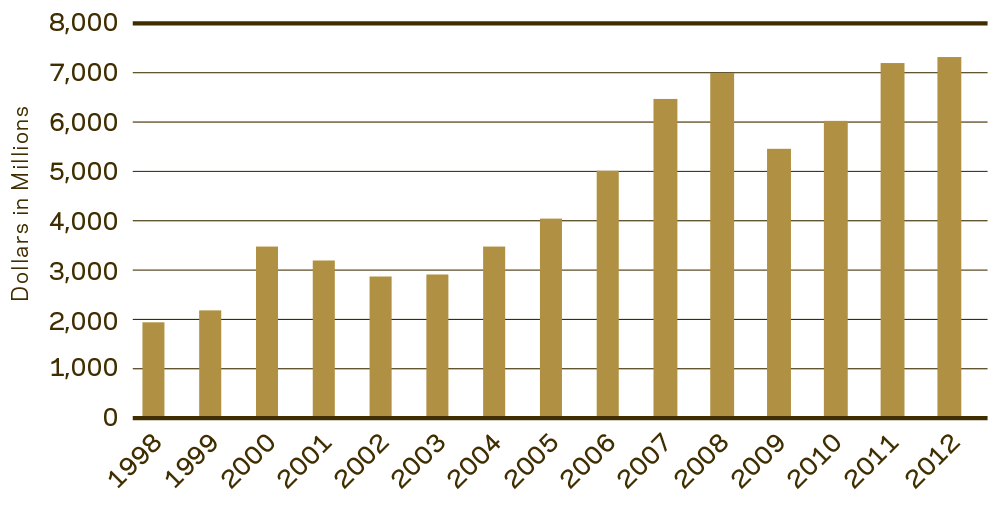
Of course we invest with an unlimited time horizon, and given the importance of steady spending from the Endowment Pool in meeting the needs of the University over time, focus more on performance over the long term than in any one year. As shown earlier, annualized Endowment Pool returns over the last 10- and 15-year periods outperformed the markets considerably, and the University’s measured spending policies have allowed distributions from the Endowment Pool to continue to increase despite the overall economic difficulties of recent years.
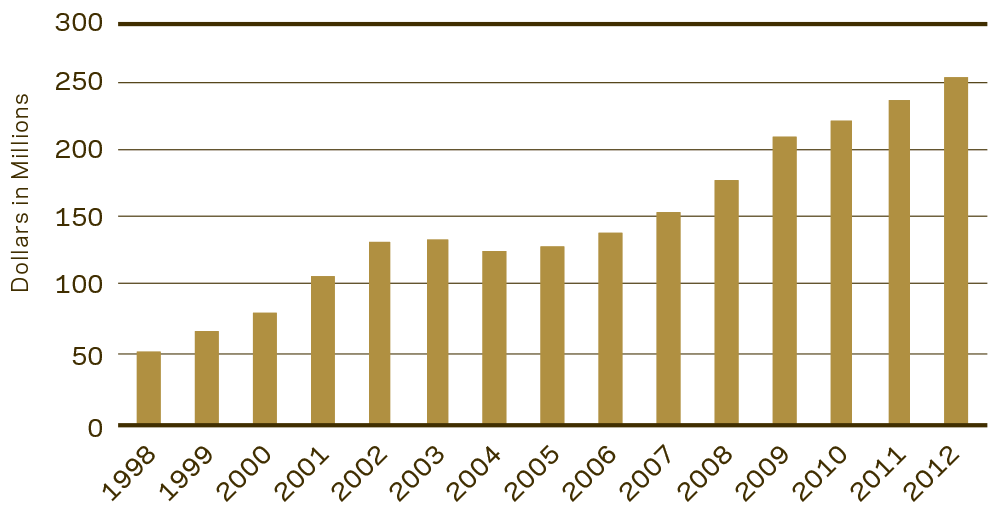
Endowment Pool spending exceeded $258 million for the fiscal year, an increase of 7.4 percent over the prior year, equating to 22 percent of the University’s expenditures.
Endowment Pool Spending
Fiscal Years Ended June 30
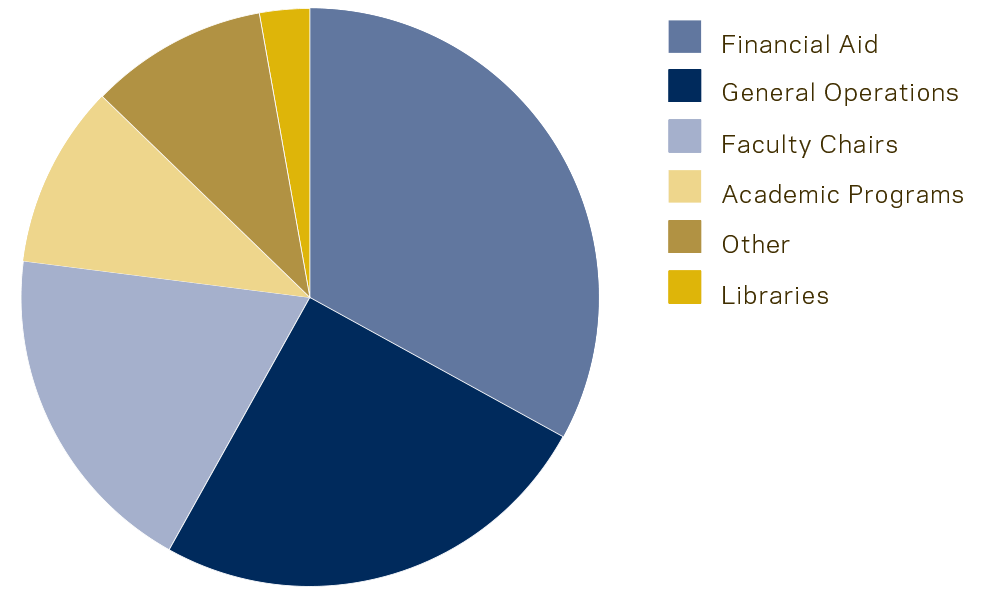
Endowment Pool Spending Purposes
Fiscal Year Ended June 30, 2012
An unwavering commitment to risk management as a core element of investment strategy will help to preserve the vital contribution of Endowment spending to University life. Thoughtful diversification and careful manager selection, as noted above, have been hallmarks of our process. Careful attention also is paid to liquidity of the investment pool, and metrics like country and currency weightings, manager concentrations, counterparty exposures, and scenario analysis all inform the decision-making process in actively managing the portfolio. Extensive efforts similarly are devoted to minimizing operational risks within investment funds, including due diligence over fund manager operations, valuations, internal controls, and compliance infrastructure.
Even as uncertainties remain in the economy and the global capital markets, the Endowment Pool is well positioned to continue its support of the University’s aspirations and strategic priorities.
SCOTT C. MALPASS
Vice President and Chief Investment Officer

